Twitch Streamers Tableau Visualization
This project aimed to explore some data analysis within Tableau. Having used the software a few times prior, I decided to explore some data that I found on Kaggle that showed a few statistics for Twitch Streamers. While this was published in 2019 and doesn’t reflect necessarily reflect current creators on the platform, it was still a fun exercise. The following few paragraphs will walk through basic analysis and my choice for each figure generated in the dashboard/infographic.
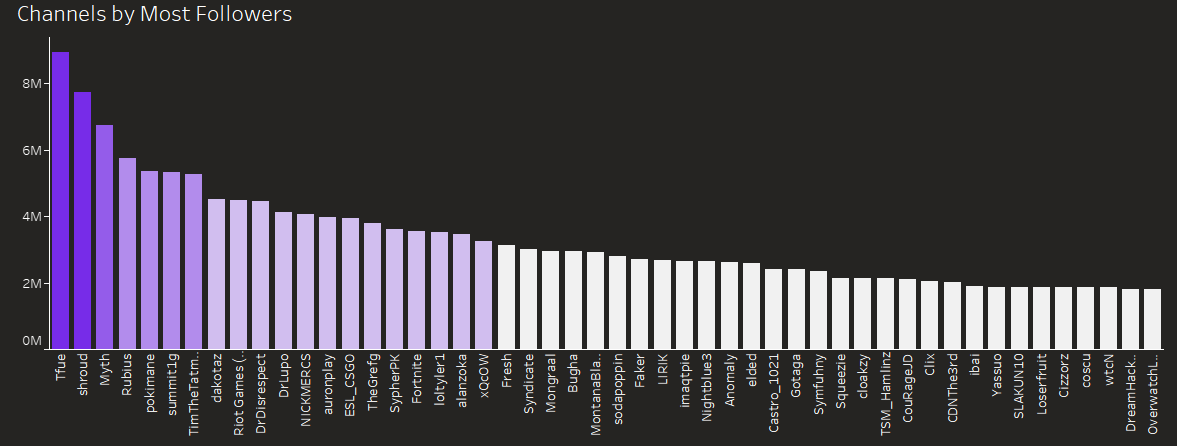
The first and likely the most direct measure of success for a creator on the platform would be their total number of followers. As we can see, at the time this snapshot was taken, Tfue was well in the lead with nearly 9 Million followers, and shroud close behind at nearly 8million himself. One large take away from this figure was the large drop off in follower counts as we move down the list. Certainly, many streamers had already developed a significant following on the platform by this time.
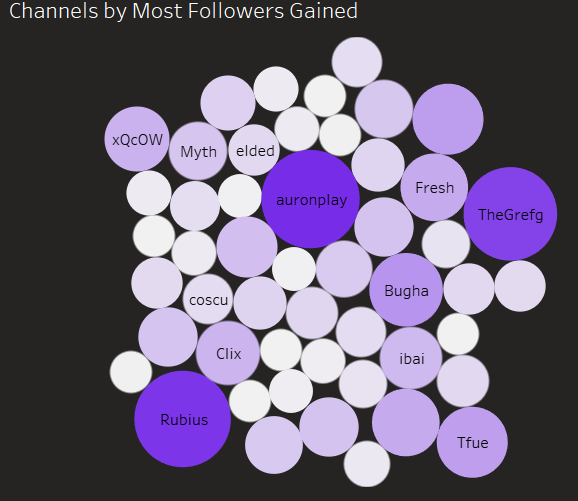
The next figure, and likely a question that would very nicely follow the first graphic, who has gained the most followers over the last year? It’s clear in this figure, while Tfue and shroud were leading in total followers they faced competition from exponentially growing creators like auronplay and TheGrefg who amassed 3.9million and 3.5million followers respectively that year alone.
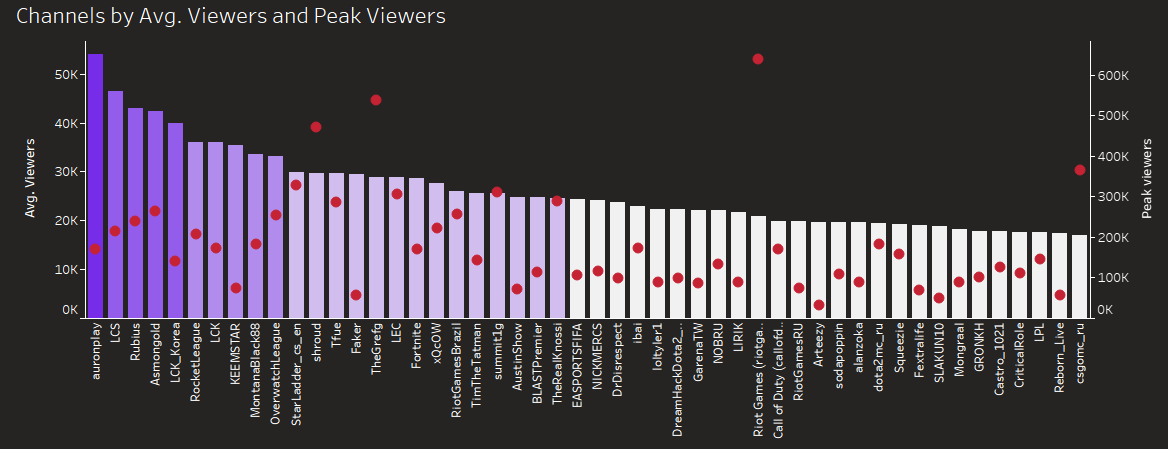
Another important metric for these streamers is the average number of viewers they bring in. As we can see by the graph, previously mentioned auronplay was averaging over 50k viewers per stream. This compared to TheGrefg who had average around 30k seemed to put in him quite the dominant spot. For additional information I also included the peak viewer count which would represent the most viewers a streamer as ever had at one time. These large peak viewer counts would largely be confined to big events, such as the twitch channel run by RIOT games (creator of League of Legends and Valorant) who had a peak viewership of 639k viewers.
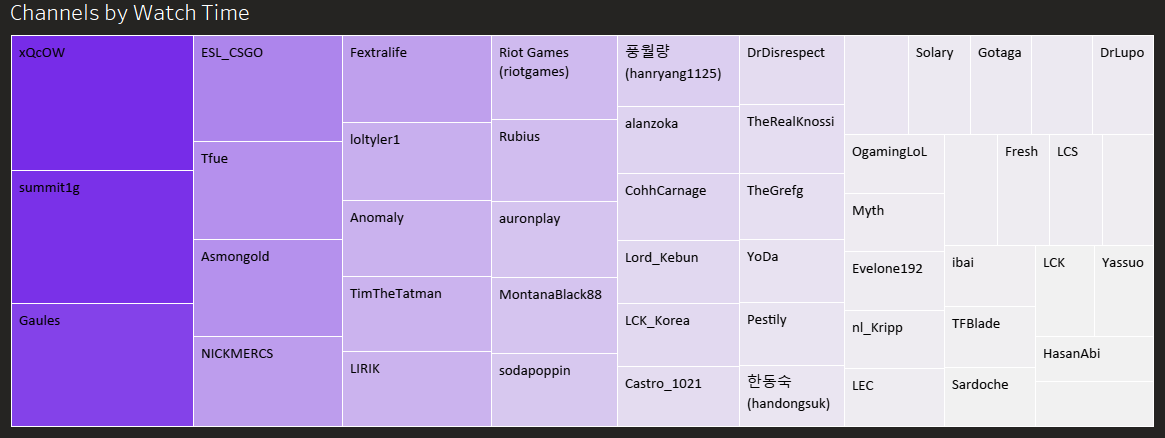
Lastly, we look at total Watch Time via a heat map. Interestingly, or maybe unsurprisingly, the most popular channels or highest viewer average didn’t make up the top Watch Time minutes. This is likely a result of these streamers having been around on the platform longer. The top competitors here were xQcOW and summit1g, amassing 6.2billion and 6.1billion watch time minutes. This translates to about 10million hours.
If you’d like to interact with the graphic yourself, please head over to my public tableau page. This infographic is available here
Thanks for reading!