Representation in the Olympics
This project was a quick visualization on a dataset that I found through a weekly community known as Tiny Tuesday. Though the data was published over a year ago, it’s still a great dataset to practice some visualizations on. For this dataset I chose to use Tableau again!
The dataset today contains data from the Olympics between 1896 and 2016. The main story were looking at here is how has representation in the Olympics has changed.
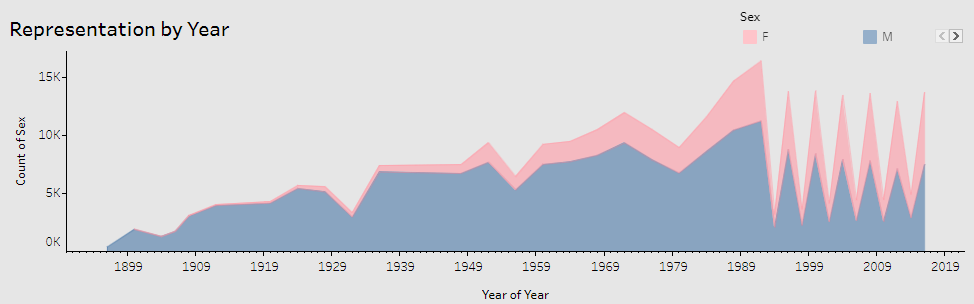
The first visual here takes a look at representation across the Olympic games, what a massive change over the last few years! It’s also important to note, many of the “dips” you’re seeing across the graph is Winter Games vs. Summer Games, as the Summer Olympics is a much bigger event. Also seems to show less representation within the winter Olympics.
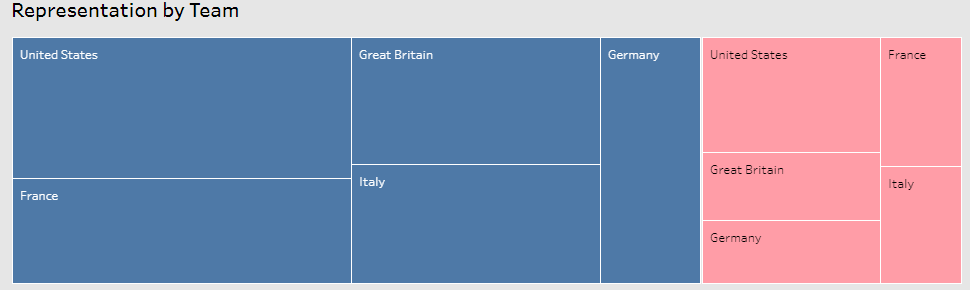
Next, it’d be interesting to see the top countries by both Sex representation. All 5 top countries by count of male participants, also make up the top 5 by count of female participants. This is fairly logical.
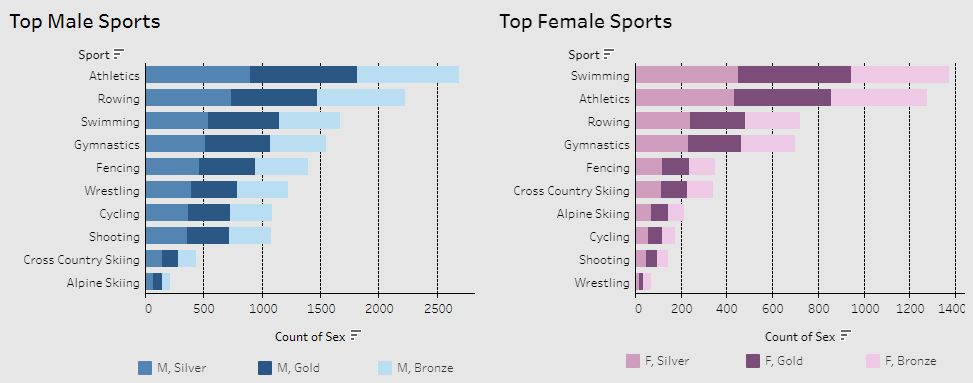
Lastly, lets look at the top male and female sports by medal count. Interestingly, Swimming, Athletics and Rowing make up the top 3 for both Sex’s.
Please interact with the dashboard yourself, available here. Thanks for reading!