Portfolio Optimization in Python
Hi! This post will go over a project I completed to analyze a portfolio of stocks using python and various packages. For the purposes of this write up, I’ll be choosing a few stocks to create a portfolio.
For this analysis, were going to be creating portfolios of the following tickers: GSPC, AAPL, META, MFST, NFLX, GOOGL.
Before we do that, lets look at how these stocks are correlated. We can do this via a heatmap. As expected, stock prices among this group appear to be fairly highly correlated
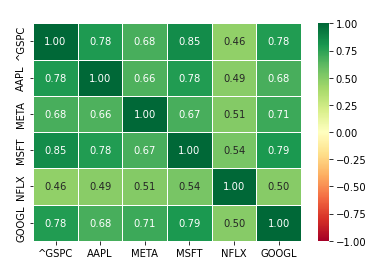
This comes as no surprise if you were at all familiar with these companies. This is certainly not the way to build a well-balanced portfolio, but this is for fun so why not!
Now let’s start creating some portfolios from this collection. To do this, we’ll generate semi-random weightings among the stocks, allowing for shorting (negative % holdings) but ensuring the total portfolio has a 100% allocation to the market. For this example, we’ve taken 10,000 samples.
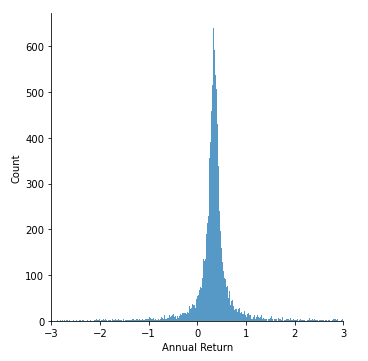
The most likely question after this, how did the portfolios perform? For this, lets take a look at the annualized returns distribution for our portfolios.
Alright, following that it might be interesting to see how our worst and best performing portfolios. The portfolio with the lowest return boasted a -1,358% loss with an annualize std. of 6,528% and an annualize Sharpe Ratio of -0.208. The allocation of the portfolio was -7171% GSPC, 2152% AAPL, -3286% META.,-19,561% MSFT, 19,185% NFLX, 8,682% GOOGL. On the other side of things, our best performing portfolio boasted 4,834% annual returns with a standard deviation of 15,863% and an annualize Sharpe Ratio of 0.304. The allocation of the portfolio was 24,384% GSPC, 59,757% AAPL, -46,927% META.,-55,220% MSFT, 76% NFLX, 17,929% GOOGL.
These numbers are are obviously not realistic, nor a feasible investment strategy so let’s look at one that might be. Let’s analyze the Tangency Portfolio, i.e., the portfolio with the highest Sharpe Ratio. This portfolio returns of 83% on annualized basis with 50% std and a Sharpe Ratio of 1.66. The portfolio had the following weightings: -130% GSPC, 130% AAPL, -70% META., 105% MSFT, 1% NFLX, 68% GOOGL. These seem a little more realistic.
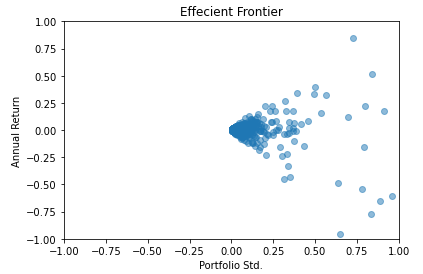
Here's what a plot of all our sample portfolios.
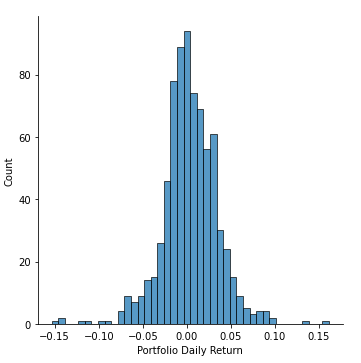
Lastly, lets dive just a little deeper into our strategy with the highest Sharpe Ratio and see if it would have performed well over time. Here’s a quick distribution of our strategy’s daily returns.
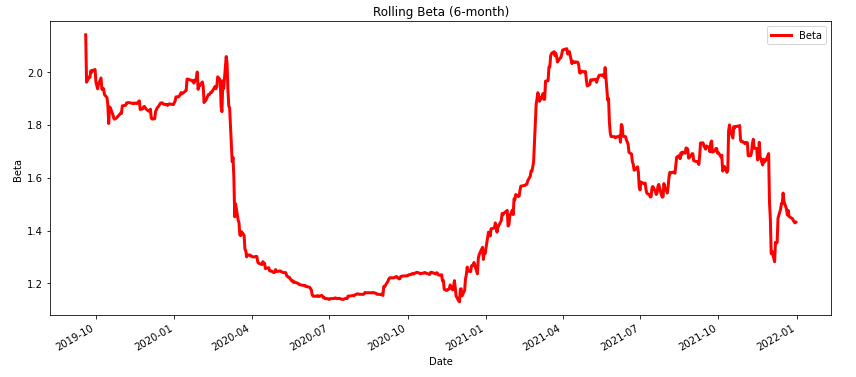
Next, let’s take a look at it’s rolling 6month Beta to the S&P 500.
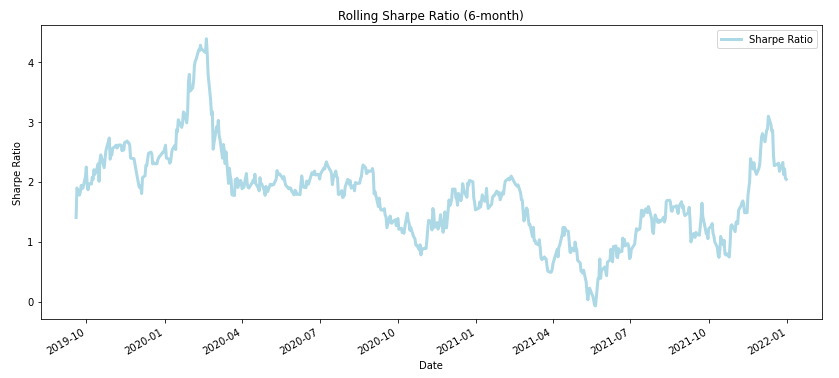
 Lastly, lets look at our strategy’s rolling 6month Sharpe Ratio.
 Yeah…maybe generating random numbers in python isn’t the way to create a successful portfolio? Even though I might not have stumbled upon the most optimized portfolio, it was still a good exercise! Thanks for reading and be
sure to check out other articles below!
Yeah…maybe generating random numbers in python isn’t the way to create a successful portfolio? Even though I might not have stumbled upon the most optimized portfolio, it was still a good exercise! Thanks for reading and be
sure to check out other articles below!